안드로이드 디버깅 방법
잡았다, 오류!
김보예
2018-06-14
디버깅(Debugging)은 오류가 발생했을 때 발생 위치를 확인할 수 있는 방법입니다. 앱이 일시 중지된 상태에서 변수를 검사하고 식을 평가해 런타임 오류 원인을 판별할 수 있죠.
중단점 걸기
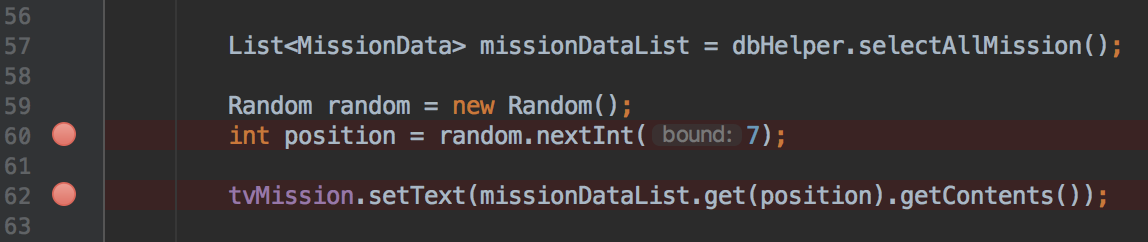
우선 확인하고 싶은 라인에 중단점을 걸어 앱 실행을 일시 중지합니다. 중단점을 거는 방법은 라인 옆의 빈공간을 클릭 하거나 단축키 (Command+F8 / Control+F8)를 클릭합니다. 아래 이미지의 라인 옆의 빨간 점이 중단점입니다.
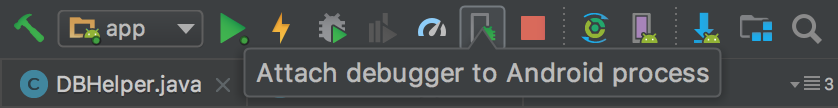
앱이 실행 중일 때
오른쪽 상단의 Attach debugger to Android process를 클릭해 디버깅 모드를 실행할 수 있습니다.
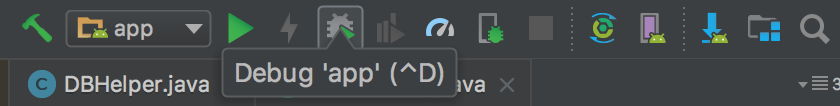
앱이 실행 중이지 않을 때
Debug ‘app’ 버튼 또는 단축키(^D)를 클릭해 디버깅 모드를 실행합니다.
앱이 실행되다가 단점을 만나면 아래와 같이 앱은 일시중지될 겁니다.
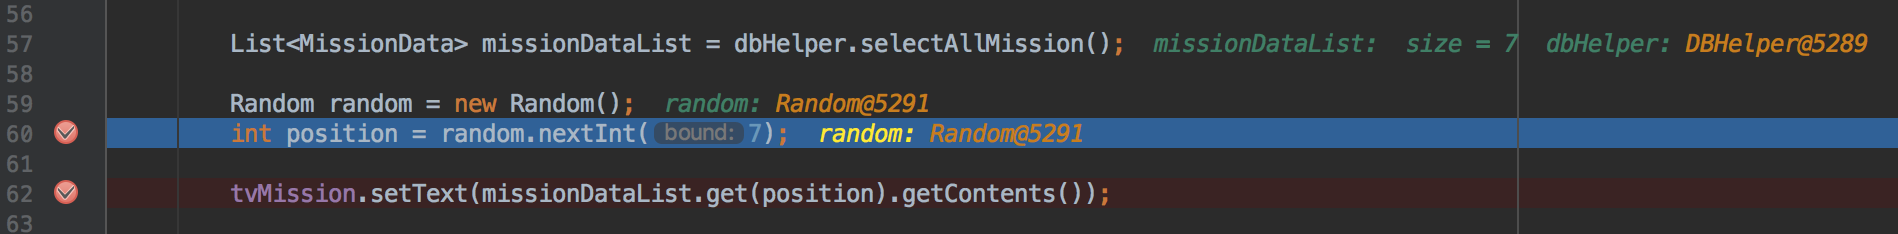
이때 디버깅 탭의 도구들을 사용해서 앱의 상태를 확인할 수 있습니다.
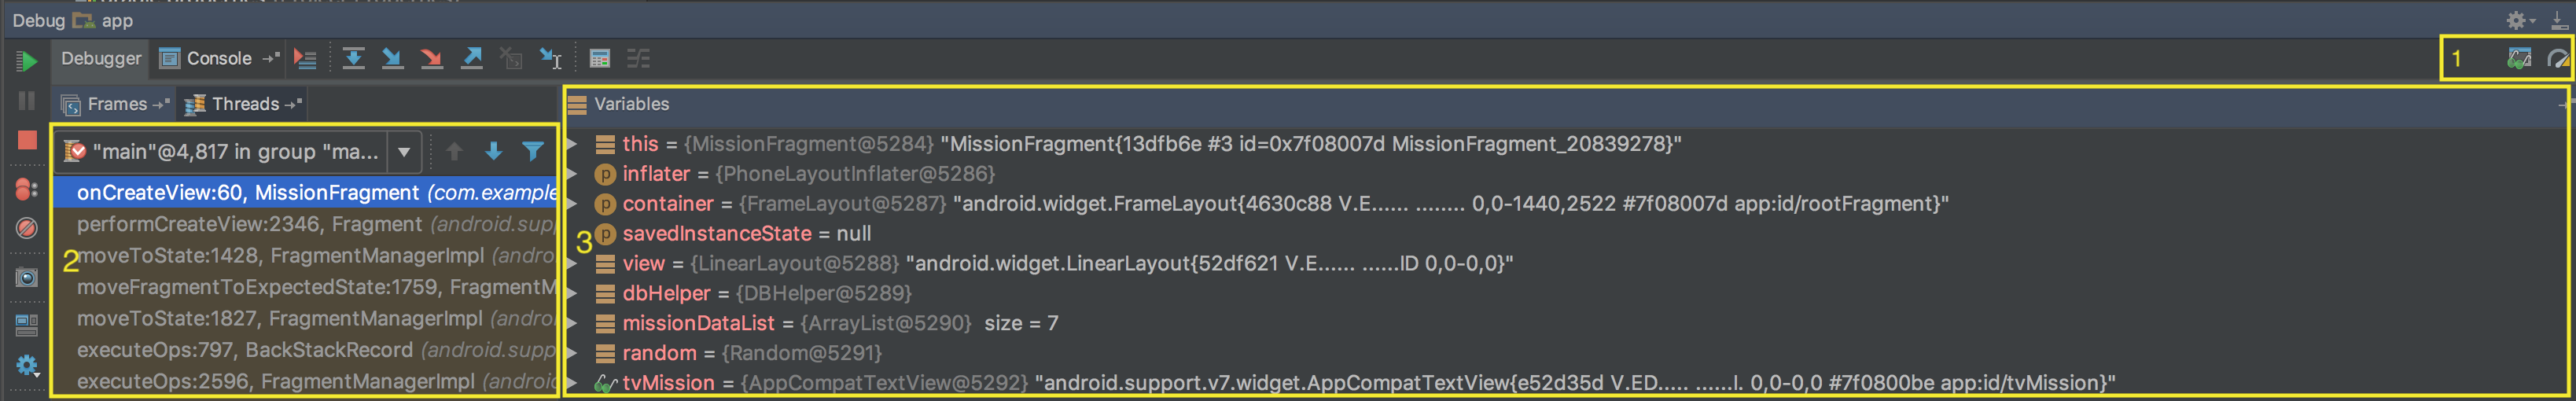
만약 Variables 영역이 보이지 않으면, 1번 영역에서 Restore Variables View를 클릭합니다. 이 영역은 변수의 객체 트리를 확인할 수 있습니다.
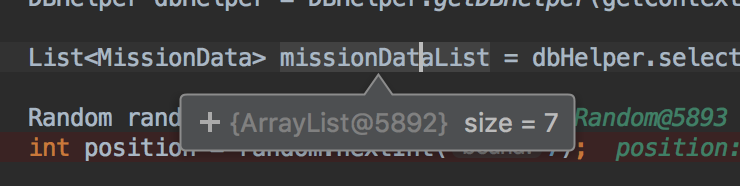
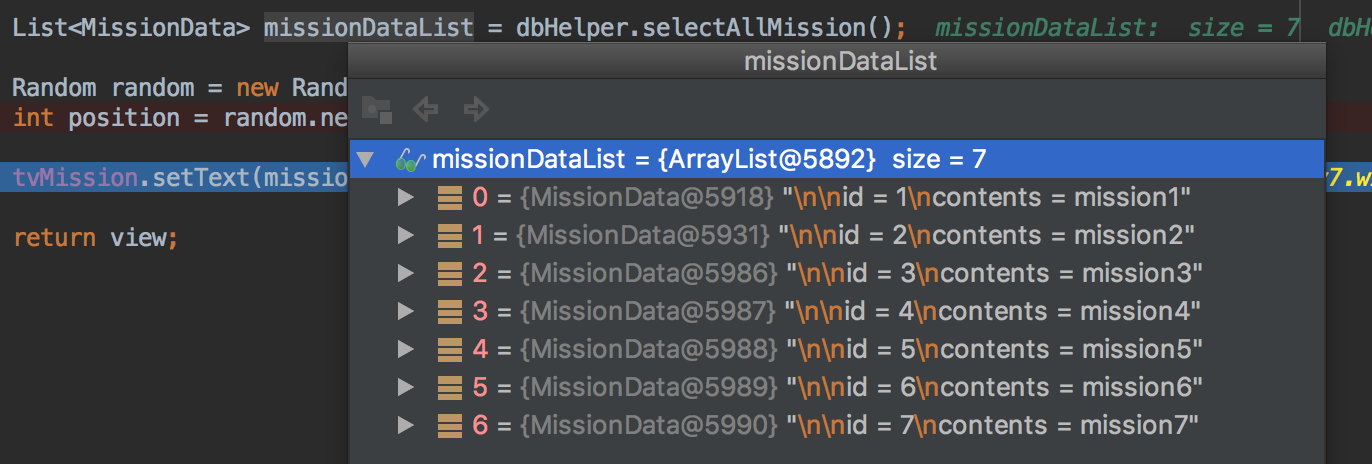
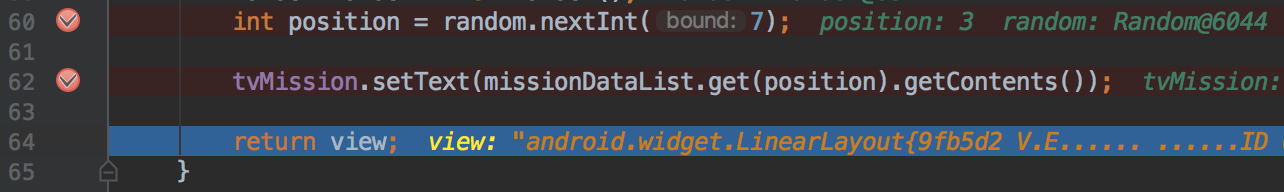
변수 위에 마우스 커서를 올리면 Variables 영역을 보지 않고도 변수를 확인할 수 있습니다. + 를 누르면 더 자세한 객체 트리도 확인할 수 있습니다. 객체는 왼쪽의 화살표를 누르면 객체에 속한 필드도 확인할 수 있습니다.
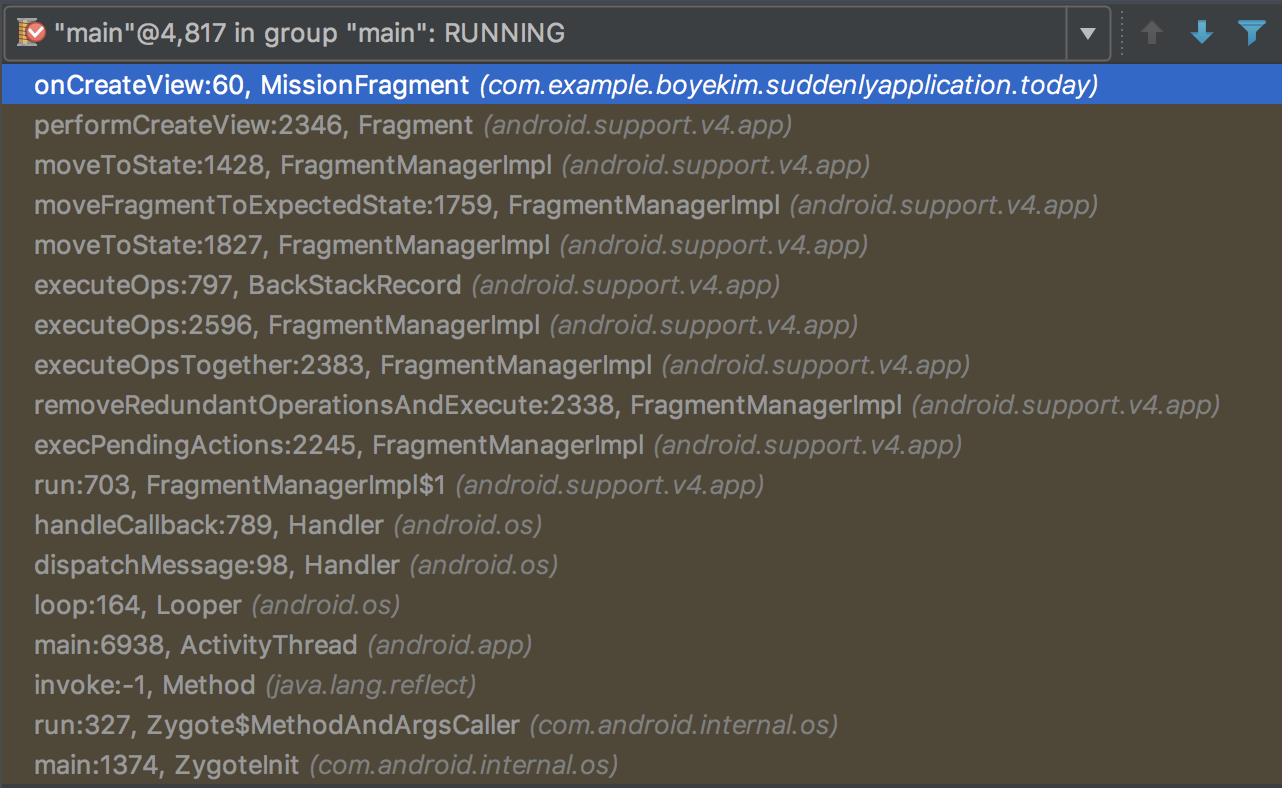
2번 영역은 현재 어느 메서드에 멈춰있는지 알려줍니다. main에서 시작해 run, invoke… onCreateView에 일시중지한 것을 보여줍니다.
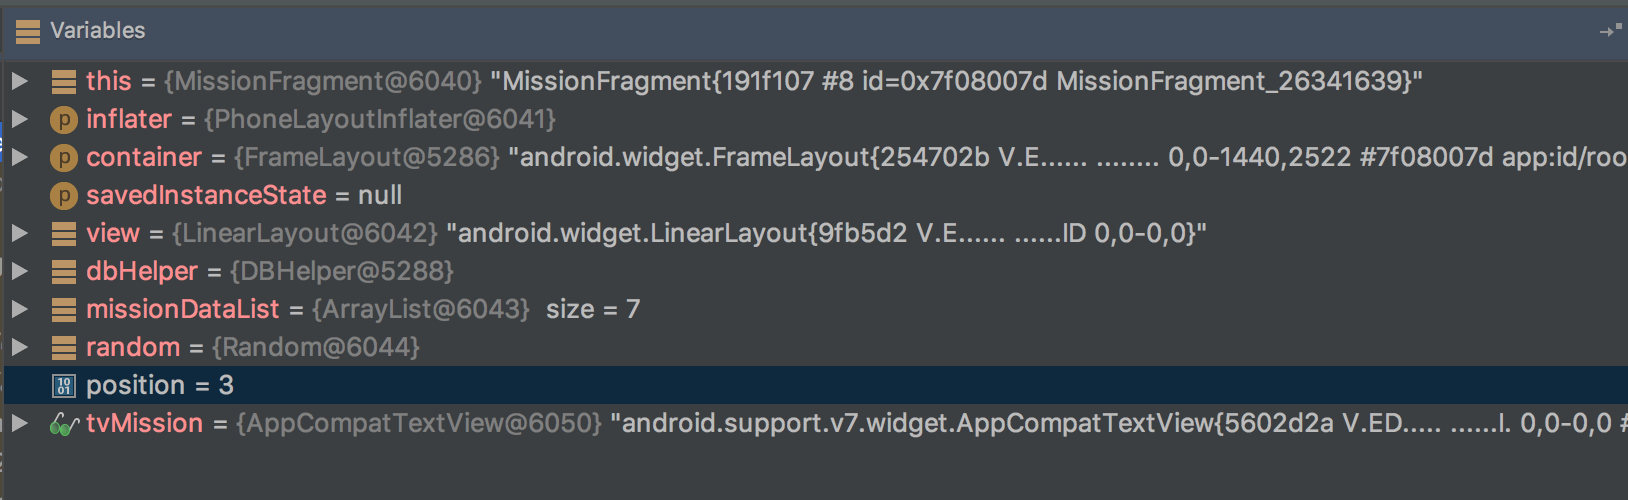
1번 영역의 Restore Watches View를 클릭하면 아래 화면이 보입니다.
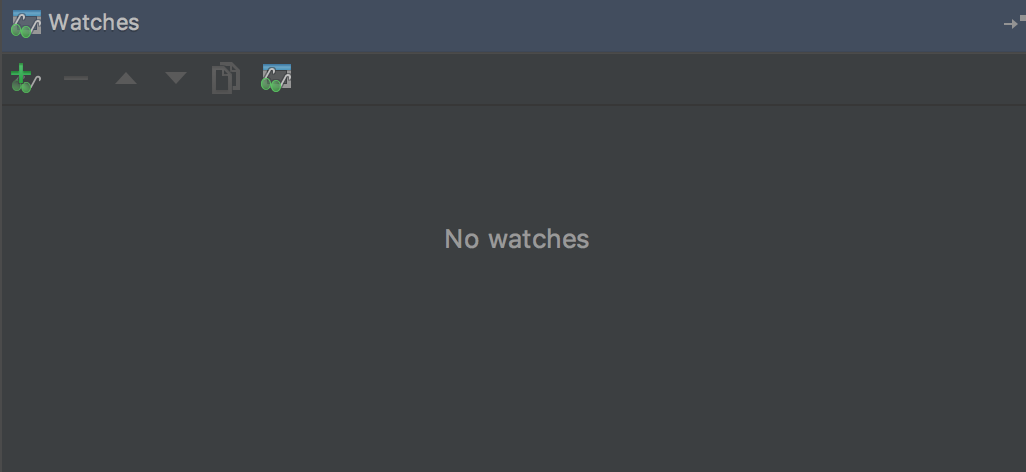
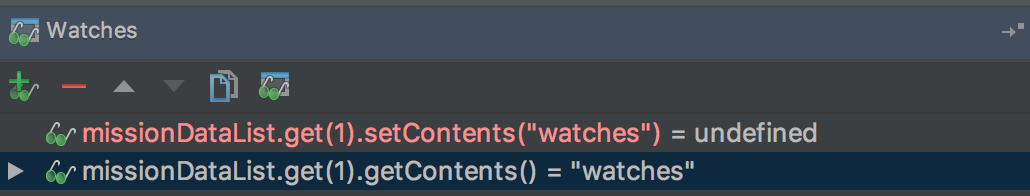
Watches는 break 된 상태에서 코드를 실행할 수 있는 창입니다. 모든 코드를 사용할 수 있는 것은 아니고 현재 라인에서 사용 가능한 코드만 쓸 수 있습니다. + 버튼을 눌러 확인하고 싶은 코드를 입력하면 결과를 바로 확인할 수 있습니다.
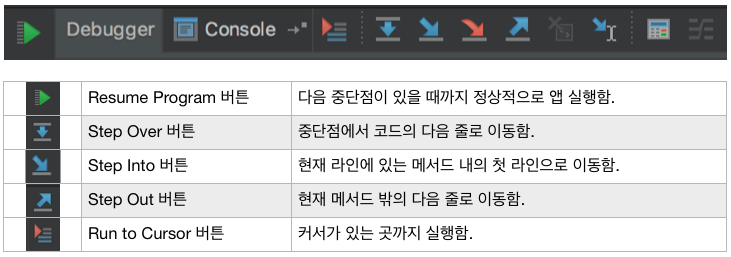
아래 이미지는 디버깅 탭입니다. 각 버튼의 기능을 알아볼까요?
중단점을 만나 일시중지된 상태에서 Step Over 버튼을 클릭해 다음 줄로 이동합시다.

Step Into 버튼을 클릭해 getContents() 메서드의 첫 라인으로 이동합니다.

Step Out 버튼을 클릭해 getContents() 메서드 밖의 다음 줄로 이동합니다.

Step Over 버튼을 눌러 코드의 다음 줄로 이동합니다.

지금까지 안드로이드 디버깅 방법을 알아봤습니다. 기능이 많아서 처음부터 다 활용할 순 없겠지만 계속 기능을 사용하다 보면 점점 익숙해지지 않을까요?
참고
앱 디버깅 | Android Developers
급식어플 블로그 : 네이버 블로그
김보예 | MA팀
kimby@brandi.co.kr